2 Kenna Cartwright Nature Park
Peter Tsigaris and Jake Truscott
Introduction
This chapter is a condensed version of a paper accepted for publication in the Journal of Rural and Community Development (Truscott snd Tsigaris, forthcoming). The research attempts to estimate the value people place on Kenna Cartwright Park as a form of capital that is being preserved for the social benefits it provides to the community. The purpose is to provide an initial and reasonable estimate of the value of the Kenna Cartwright Park and its ecosystem services enabling policy-makers to make better-informed decisions with regard to managing, enhancing, and protecting the park. It is important to place a value on all assets including public goods like parks. Translating the ecosystem services of the park into monetary values will show the degree of scarcity of the resource. As a result, the valuation indicates the importance of maintenance, enhancement, risk management, and biodiversity conservation. Furthermore, potential ecosystem losses affect our well-being and require compensation. The following section provides a brief description of the park, followed by methodology, then results are presented, and ends with a short discussion and concluding remarks.
Kenna Cartwright Park
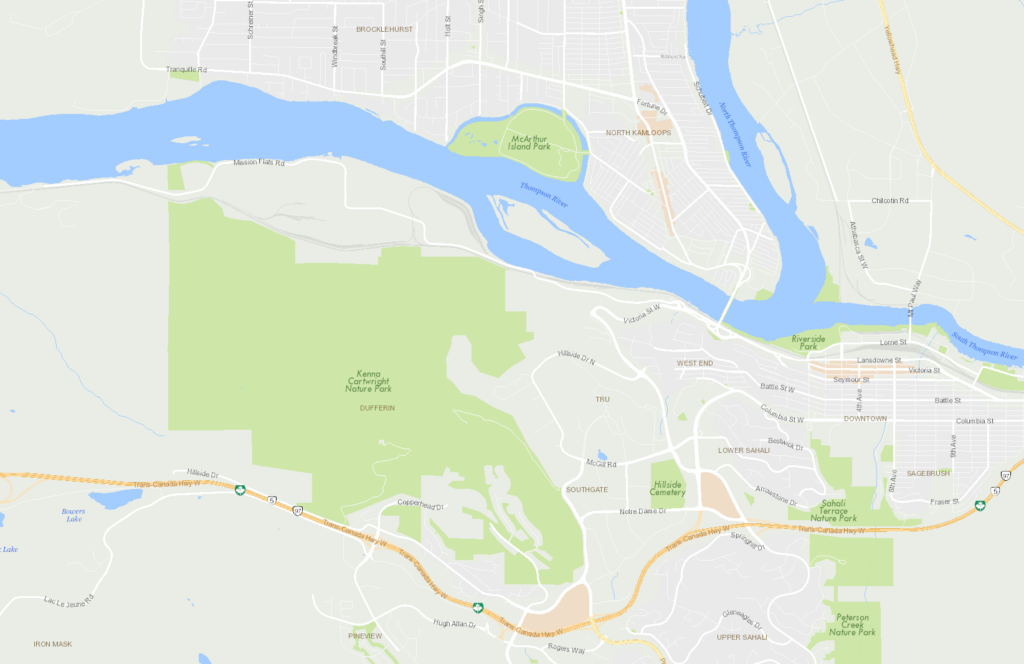
Kenna Cartwright Park is a 749 ha park located on the southwest outskirt of the rural-urban fringe of the city. It is named after a former mayor and long-time proponent of nature conservation. The park was established in 1996 (Mt. Dufferin Land Use Plan, 1996). The plan included 600 residential units in the Mt. Dufferin neighborhood area. Figure 1 exhibits a map showcasing 749 hectares in size of Mount Dufferin – Kenna Cartwright Park. It is the largest municipal park in British Columbia and the ninth-largest urban park in Canada (City of Kamloops, 2021, World Atlas, 2020).
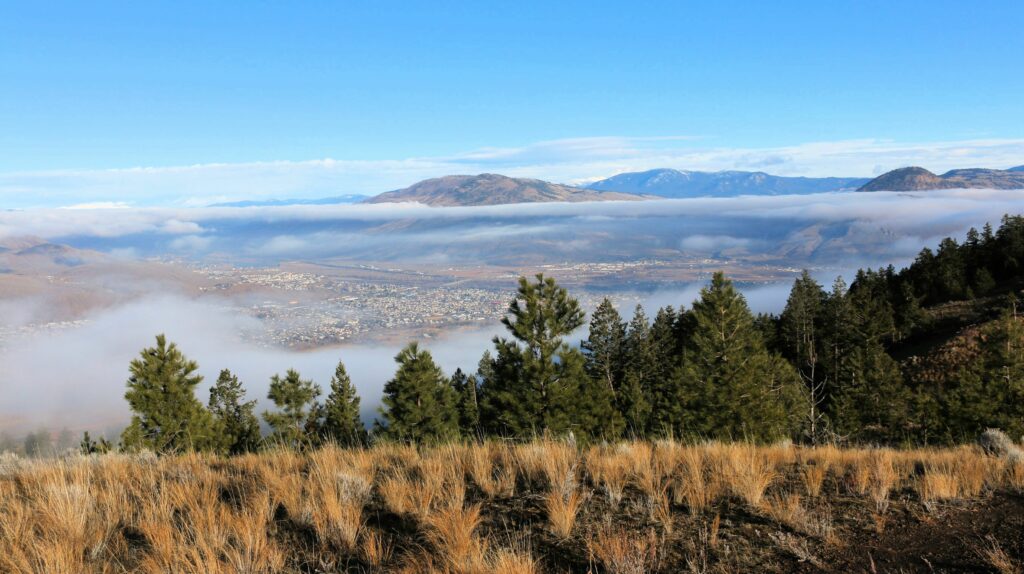
The biome contains grasslands, hills, Douglas Fir and Ponderosa Pine forests, sagebrush, wetlands, and valleys. Wildlife is abundant, including numerous birds, black bears, coyotes, chipmunks, deer, and insects. The natural setting has been modified with walkways and numerous named hiking trails to accommodate visitors to enjoy recreational and cultural services. The primary attraction is the vast 40km network of gentle nature trails leading to lookout spots, some offering a 360 – degree panoramic view of Kamloops (Figure 2). The scenic views are breathtaking at the top of Mount Dufferin or the northern part of the park overlooking Kamloops Lake.
Methodology
In order to estimate the value of the park and the annual ecosystem services derived from Kenna Cartwright Park, a modified version of the holistic approach used by Sutton and Anderson (2016) is applied. Unlike Sutton and Anderson (2016), which used an appraisal firm’s estimate, the Kenna Cartwright’s valuation uses land values of built capital surrounding the park as per the equivalency principle advanced by Chiabai et al, (2013). The equivalency principle is “based on the premise that the long-term value of a piece of undeveloped land ought to be at least the same as the value of an identical piece of land in the vicinity to which permission has been granted for development.” As a result land values surrounding Kenna Cartwright Park were downloaded on May 5th, 2021 from the BC real estate assessment website. A total of 514 land values with single-detached homes were converted on a per hectare basis and averaged to get a unit price. This unit price was then multiplied by the 749 hectares of park size to determine the park’s estimated valuation.
To find the value of the annual ecosystem services provided by urban parks a European and global value transfer function from the meta-analysis conducted by Bockarjova et al. (2020) was employed instead of assuming a 5% annual rate of return as in Sutton and Anderson (2016). This method allows the integration of previous studies which assess the benefits people receive from ecosystem services parks provide.
In addition, the yield, or rate of return of the asset, is computed by finding the ratio of the estimated value of the flow of ecosystem services in 2020 relative to the valuation of the park.
Finally, the future growth rate of the ecosystem services was estimated using a simple dividend growth model. This is equal to the social discount rate of 3.5%, which is commonly used in cost-benefit studies for public projects such as health intervention and policies in high-income nations (Boardman et. al, 2010; Haacker et. al, 2020), net of the yield obtained from the park in the year of investigation (provided the yield is lower than the social discount rate). In the case that the yield is higher than the social discount rate, the future growth rate will be negative to bring it closer to the social discount rate in the long run.
Results
The table below shows descriptive statistics. The average land value is $264,535 for 514 single detached residential homes on an average lot size of 0.088 hectares. Land values range from a minimum of $208,000 to $434,000. The size of the lot also has ranged from 0.038 to 0.85 hectares. When the land values are converted on a per hectare basis, the mean land value is $3.5 million, ranging from as low as $407K to a maximum of $5.9 million. However, it is worth pointing out that the value of land per ha from 1996 onwards (CDN$) as per the 2020 BC assessment, when the park was officially established, averages $3.96 million, while the value before, as per the 2002 BC assessment, averages at $3.05 million.
Table 1: Descriptive statistics of 514 residential houses by Kenna Cartwright Park
| Variable | Mean | StDev | Minimum | Q1 | Median | Q3 | Maximum |
|---|---|---|---|---|---|---|---|
| Land Value | 264,535 | 29,107 | 208,000 | 244,000 | 260,000 | 280,000 | 434,000 |
| Building Value | 338,350 | 118,650 | 49,900 | 247,000 | 316,000 | 397,250 | 893,000 |
| Year Built | 1994 | 16 | 1958 | 1976 | 1995 | 2006 | 2020 |
| Size (in Ha) | 0.088 | 0.058 | 0.038 | 0.057 | 0.072 | 0.098 | 0.850 |
| Land value per Ha | 3,496,417 | 1,010,246 | 407,136 | 2,784,241 | 3,424,265 | 4,253,906 | 5,928,365 |
Table 2: Value of Kenna Cartwright Park and its ecosystem services
| Characteristics | Kenna Cartwright Park |
|---|---|
| Ecosystem services per ha per year (USD) – ETF | $50,951 |
| Ecosystem services per year (CND) – ETF | $45.7 million |
| Ecosystem services per ha per year (USD) – GTF | $65,312 |
| Ecosystem services per year (CND) – GTF | $58.6 million |
| Value of green infrastructure – 1996 onwards (CDN$) | $2.96 billion |
| Social discount rate | 3.50% |
| Estimated 2020 yield or rate of return – ETF | 1.54% |
| Annual growth rate of ecosystem services – ETF | 1.96% |
| Estimated annual yield or rate of return – GTF | 2.00% |
Discussion and conclusion
The preservation of Kenna Cartwright Park in Kamloops is without a doubt of significant value to its residents. A conservative value for Kenna Cartwright is estimated to be $2.96 billion and yielded $45.7 million in annual ecosystem services in 2020. The annual ecosystem services represent 1% of Kamloops’ GDP based on a 4.6 billion GDP (Venture Kamloops, 2020). On a per-capita basis, the yield from Kenna Cartwright’s ecosystem services amounts to approximately $500 for each Kamloops resident, and each person has $28.8 thousand worth of green infrastructure capital equally distributed. In addition, Kenna Cartwright Park is estimated to be 12.5% of the $24 billion in built capital.
The estimated 45.7 million CDN$ per year from Kenna Cartwright Park’ ecosystem services is substantially lower than that of assuming a 5% yield as per the assumption of Sutton and Anderson (2016). The yield is lower because the nature park is a relatively riskless highly valued asset and its high valuation captures the fact that the value of ecosystem services will grow in the future at 2% per year. The value of the 2020 ecosystem services is not constant but is estimated to increase at the rate of 2% per year, which is similar to the long-run growth rate of Canada’s standard of living of 2% measured by GDP per capita. Using the GTF, the annual yield increases to 2% per year with a 1.5% annual growth rate of the value of ecosystem services. In the future, a survey should be conducted on visitors to determine the value of ecosystem services they enjoy from the park.
References
Bockarjova, M., Botzn, W. J., & Koetse, M. J. (2020). Economic valuation of green and blue nature in cities: A meta-analysis. Ecological Economics, 169, 106480. https://doi.org/10.1016/j.ecolecon.2019.106480
Boardman, A., Moore, M., & Vining, A. (2010). The Social Discount Rate for Canada Based on Future Growth in Consumption. Canadian Public Policy / Analyse De Politiques, 36(3), 325-343. Retrieved May 26, 2021, from http://www.jstor.org/stable/20799660
British Columbia Assessment (2020). British Columbia Property Values. Kamloops BC. Retrieved from: https://www.bcassessment.ca/. Accessed on February 21, 2021.
Chiabai, A., Galarraga, I., Markandya, A. et al. (2013) The Equivalency Principle for Discounting the Value of Natural Assets: An Application to an Investment Project in the Basque Coast. Environment and Resource Economics 56, 535–550. https://doi.org/10.1007/s10640-012-9589-8
City of Kamloops (2021). Parks & Recreation: Kenna Cartwright Nature Park. Retrieved from: https://www.kamloops.ca/parks-recreation/parks/kenna-cartwright-nature-park. Accessed on February 21, 2021.
Gordon, M., & Shapiro, E. (1956). Capital Equipment Analysis: The Required Rate of Profit. Management Science, 3(1), 102-110. Retrieved May 26, 2021, from http://www.jstor.org/stable/2627177
Haacker, M., Hallett, T. B., & Atun, R. (2020). On discount rates for economic evaluations in global health. Health policy and planning, 35(1), 107-114. https://doi.org/10.1093/heapol/czz127
Kamloops This Week (KTW) (2021). Average selling price of a single-family home in the Kamloops area reaches $686,000. Published by: Kamloops This Week. Retrieved from: https://www.kamloopsthisweek.com/news/average-selling-price-of-a-single-family-home-in-kamloops-area-reaches-686-000-1.24303310. Access on April 6, 2021.
Statistics Canada. 2017. Kamloops [Census agglomeration], British Columbia and British Columbia [Province] (table). Census Profile. 2016 Census. Statistics Canada Catalogue no. 98-316-X2016001. Ottawa. Released November 29, 2017.
Seto, K. C., Golden, J. S., Alberti, M., & Turner, B. L. (2017). Sustainability in an urbanizing planet. Proceedings of the National Academy of Sciences, 114, 8935–8938. https://doi.org/10.1073/pnas.1606037114
Sutton, P. C., & Anderson, S. J. (2016). Holistic valuation of urban ecosystem services in New York City’s Central Park. Ecosystem Services, 19, 87-91. https://doi.org/10.1016/j.ecoser.2016.04.003
Truscott, J. and P. Tsigaris, (forthcoming), Assessing the Value of a Park in a Rural–Urban FringeZone: A Case Study of Kenna Cartwright Nature Park in the Interior of British Columbia, Journal of Rural and Community Development
Venture Kamloops (2018). Economic Impact Study – Venture Kamloops. Retrieved from: https://www.venturekamloops.com/pdf/economic-impact-study-2018.pdf
World Atlas (2020). World Facts: 10 Largest Urban Parks In Canada. Published by WorldAtlas. Retrieved from: https://www.worldatlas.com/articles/largest-city-parks-in-canada.html
